The main reason of losing a stock at Intraday is due to our wrong ‘entry’ only
- Knowingly or unknowingly we make our Intraday entry in the direction
of our own assumptions, or as advised by some so-called stock experts, or maybe as per the news and newspapers predictions. This ‘entry’ usually goes in the opposite direction of the ‘Trend’ even when the ‘Trend’ is fully visible and is clear to everyone. - We enter the trade at early stages when the trend is not fully clear to us with the all available charts and prices. This entry goes in the opposite direction of the trend when the trend is most visible and is clear to any one as per the current charts and prices.
It is better to wait than to enter wrongly till ‘Buyers & Sellers’ are fighting for supremacy and the trend is not fully clear to anyone except assumption without facts, charts and prices.

Image Source: via Wikimedia Commons
The second reason of losing a stock at Intraday trading is –
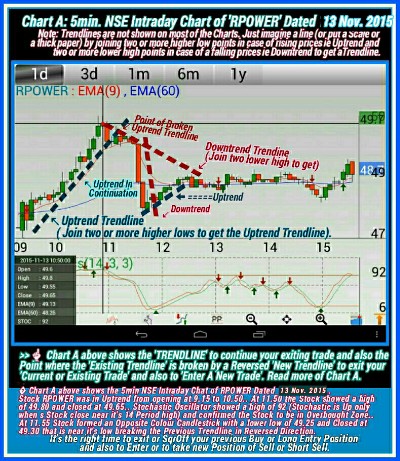
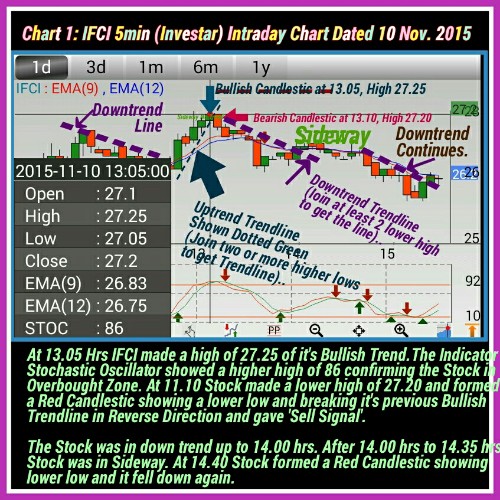
When we knowingly or unknowingly do not square off our current ‘Right Trade’ (from the low or high as the case may be) when the stock reverses it’s trend making U turn and crosses the trend line in opposite direction by forming an opposite colour Candlestick.
In that case we shall lose or will at least reduce our Profit margin if we do not square off our current position when the stock reverses it’s direction and crosses the previous Trendline in opposite direction and makes a higher high in case of Bullish Reversal and a lower low in case of Bearish Reversal even though our entry was right and we made just paper profits earlier.
Now, Check out More details on Intraday Trading
What is a trend?
A Stock or a Share with falling prices is called as a ‘Stock in Downtrend’ and a Stock or Share with rising prices is called as a ‘Stock in Uptrend.’
How to recognise an Uptrend or Downtrend when it is not clear with the current Price Movements in both up and down directions?
Here is the complete detail with justifications:
First of all, note that a Stock never moves in a straight line but in a zigzag direction. This means it goes up and again comes down, and this up and down continues all the time.
Thinking, why the movement of a Stock is in zigzag direction and not straight in up or down direction?
Read the following:
STOCK XYZ:
Current Bid Price of Buyers 25.40 (Qty 26563)
Current Ask Price of Sellers 25.45 (Qty 7437)
Buyers are buying at ‘Ask Price’ of Sellers and they consumes their all quantities at Ask Price of 25.45 . Now Buyers and Sellers both come one tick above and the current Bid and Ask prices are as under:
Bid Price 25.45 (qty 12362)
Ask Prices 25.50 (qty 27592)
Buyers are buying at Ask Price of 25.50. Sellers are also selling their Shares qty. at Bid Price of 25.45. In the last of this Bid and Ask Prices, all quantities of Buyers at Bid 25.45 are consumed either by Sellers selling at Bid Prices of 25.50 or by Buyers himself withdrawing their qty from the Bid Price of 25.45 and Stock Prices comes one Tick down again.
Now the Current Bid and Ask Prices are as under:
Bid 25.40 (qty 5372)
Ask 25.45 (qty 51685)
And this Up and Down continues all the time. That is why the movement of Prices of a Stock is always in zigzag directions. Further, if it goes more up and fall less, it will form higher lows and higher high. This means the stock is in Uptrend. This is the time when you should make an entry, in the direction of trend that is Buy (or Go Long).
Note, your Buy entry should always be when the Stock forms a higher low so always see NSE Intraday Chart or any Intraday chart (at 2min to 5min) before you enter a trade..
Further,
In Intraday Trading, Never assume that a stock will go up or down today
Never assume that a stock will go up or down today – Who knows the trend of today till it is not clear OR who knows up to where a stock will go in up or in down till it does not reverses. I and you cannot be solvent up to that time till it reverses if our entry is wrong (that is in opposite direction of trend). So, we have to enter as per the current trend when it is clear, and exit our trade only when the stock changes its direction, takes a U turn and crosses the trend line in opposite direction and makes a Green Candlestic with higher high in case of Bullish Reversal and a Red Candlestic showing lower low in case of a Bearish Reversal.
This is the only proper time to exit your previous trade and also to take a fresh or new entry.
Now see –
What is ‘Down Trend’
As you know, a Stock never moves in a straight line but in a zigzag way, that is, it goes down and then goes up all the time. If it goes more down than it’s up, then the Stock will make lower high and lower low which means Prices are falling and this is precisely what we call as ‘Down Trend.’ You can enter “Sell” (or Go for Short Sell) at the best available high when a Stock fails to make higher high and falls down forming a lower low.
See Chart positively before you go for your “Sell Entry”
Now see,
What makes the Trend and why a Stock Price goes up (i.e. Up Trend) or go down (i.e. Down Trend)?
No fundamental, No Quarterly Earning Statement, No Bullish or Bearish News, No Index NSE, BSE, NYSE, Nasdaq, London Stock Exchange whether opening in Up or down, No expert Opinions, No Stock Analysis, No Oscillator Indicator (Stochastic or RSI) or anything can ever make any particular Stock go up or down.
BUT
The Buyers and The Sellers of ‘that’ particular Stock are the only factors that can make the Stock go up or down. The Bullish and Bearish trend depends only on the mood of the Buyers and the Sellers. Note that they can change their mood any time and their mood reflects everything in Complete (i.e. fundmental, earnings, index, analysis, news, charts and indicators etc.) which actually makes your stock go Up or Down.
Now let us see –
The mood of Buyers & Sellers and how to Analyse it completely –
Every buyer (at Intraday/MIS or Delivery/CNC wants to Buy at low and sell all his Shares at high. However, no Buyer wants to buy a falling stock as he knows that there is no certain end of this falling, till it actually stops falling. This is the reason, why Buyers want to buy at the best available low i.e. when the Prices are rising or going Up.
Similarly, Intraday Seller wants to sell at high and like to buy all the shares at the most low prices. However, no Intraday or Delivery Stock holder Seller wants to sell a Stock at current Market Price when the Stock Price is rising or going Up. An Intraday Seller wants to sell a falling Stock at best available high Price and likes to buy at most low when the prices stops going further down, and takes a U turn – confirming the reversal by crossing previous Trendline and making a Bullish Candlestic by showing higher high..
Now let us see –
How Buyer and Seller behave at Bid and Ask Price of a Stock xyz (say Bid Price 47.90 & Ask Price 47.95) at two ticks below the day’s high (say 48.05) at afternoon.
Buyers put around 15000 Qty at Bid Price of 47.90. Sellers consume all the Qty by selling their Stock at Bid Price of 47.90 but are not willing to come down. Buyers then put 1000 Qty at Bid but sellers or not willing to sell now at Bid Price of 47.90. Buyers then withdraw their Qty from the Bid Price of 47.90 and come down bidding their Qty at a Bid Price of 47.85. Next, Sellers come down and put a 150 Qty at Ask Price of 47.90. There is no trading for about one minute.
After one minute the Ask Qty of 150 is either consumed by Buyers or is withdrawn by sellers and the Bid/Ask Price is now 47.85/47.95 . There is no trading or a very small trading for about 3 minutes. After 3 minutes assuming that Sellers are not willing to come down, buyers consume Sellers Qty at Ask Price of 47.95 and the Bid/Ask Price is now 47.95/48.00. There is no trading again for about one min. and after one min. Buyers come and consume all quantities of Sellers at Ask Price of 48.00 to 48.10. Stock Prices moves further Up by Breaking the Previous high..
Note: The Prices of a Stock goes Up because either Sellers are not willing to sell their Shares at low prices or their Ask Qty do not match the Buyers Bid Qty. (Uptrend – A Bullish Trend Day). Similarly the Prices of a Stock or Share goes down at a day when Buyers are not willing to Buy at Up or their Bid Qty do not match the Sellers Ask Qty. (Downtrend-A Bearish Trend Day)
Intraday Trading Strategy – Know When to Buy and/or Sell a Stock
It is best to trade a stock in the direction of its overall Day’s Trend at Correction i.e. when the overall day’s trend is Bearish, Sell a Stock at High from where it starts falling down again after Correction.
AND
when the overall day’s trend is Bullish, Buy Stock at low from where it starts going Up again after Correction.
Note: Reversal is eminent all the time so exit your current position when a stock reverses it’s direction by crossing the previous Trendline in opposite direction and makes a new opposite colour Candlestic by making higher high in case of a bullish reversal and lower low in case of a bearish reversal.
Thank You.
Wish You All A Very Happy Deepavali and a PROSPEROUS NEW YEAR..
HAVE A GREAT TRADING DAY AHEAD!!
Do Not Miss Reading:
How & When To Enter Intraday At Correction and Reversal
Know the Best Stock Market Brokers in India
Know How And When To Enter & Exit Intraday Trading
How to Start Trading in Stock Market ~ Beginner’s Guide
