In Stock Market Trading, Technical analysis is based on the assumption that prices move in a trend. That is –
If it goes up, it will go up till reversal and if it goes down, it will go down till reversal.
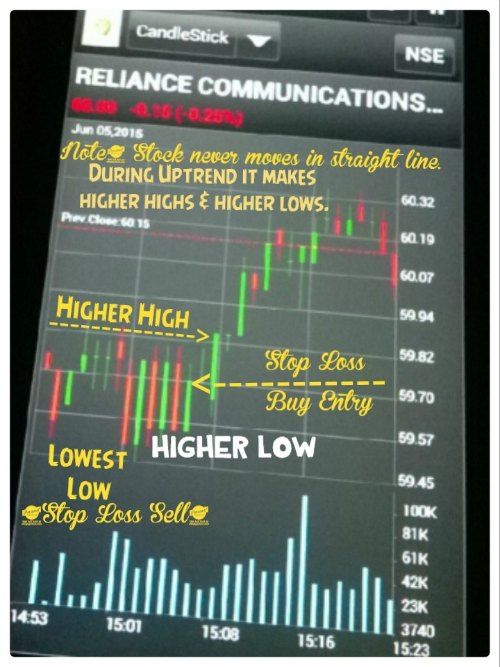
However, a stock never moves in a straight line. When it is going up, it will go up and will drop down a little in next. Again it will go up and will again drop a little. Thus in Uptrend it makes higher highs and higher lows continuously till it reverses. Similarly in down trend it makes lower highs and lower lows till reversal..
Following is NSE, RCOM Intraday Chart showing Uptrend Reversal.
The stock was in Downtrend previously and then it reverses it’s direction to Uptrend by showing lowest low and again a higher low tested in it’s next two, three moves. The stock again went up showing higher high. Thus confirming the reversal and continuation of Uptrend.
The Intraday Chart shows the Entry Point to Buy (To Go Long) with stop loss in case of any worst. You are advised to revise your stop loss again and again till the stock goes higher and higher. Your stop loss must be two tick below the previous higher low. That’s All.
Wish You A Happy Trading!! 
Do Not Miss Reading:
Know How And When to Enter & Exit Intraday Trading
How To Start Trading in Stock Market ~ Beginner’s Guide


